Crane Numbers Stay High as Aussie Construction Holds Its Own

Construction crane activity across Australia remains strong, with 838 cranes currently in operation nationwide.
According to the RLB Crane Index for the first quarter of 2026, the total is slightly down from 845 in the previous quarter, but still reflects a buoyant construction sector with national work done in 2025 reaching a record $318 billion.
New South Wales continues to lead national construction activity, accounting for 46 per cent of all cranes.
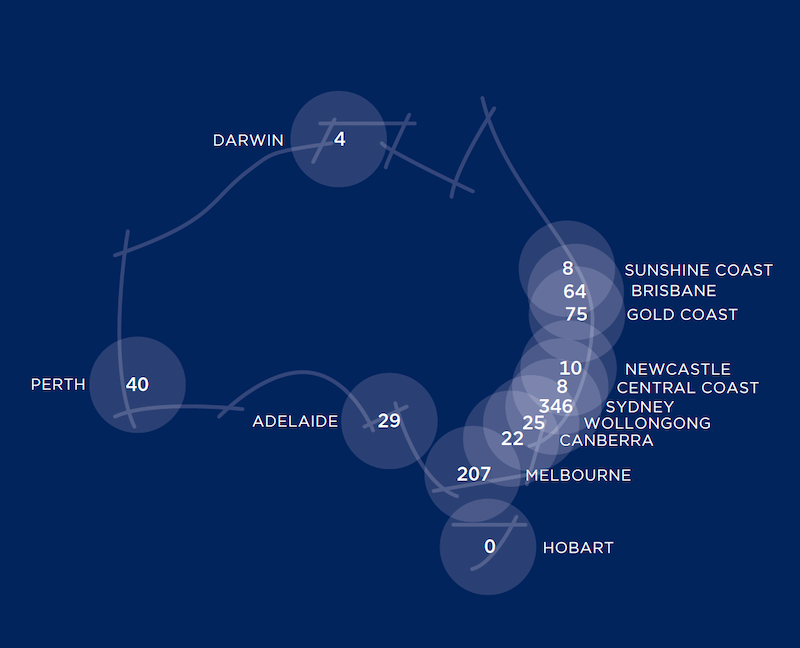
Sydney remains the epicentre of activity with 346 cranes in operation, down from 370 in the previous quarter, representing 43.8 per cent of all cranes nationwide.
Residential construction in Sydney has eased slightly, with 204 cranes, while non-residential cranes fell to 142, and total work done in NSW in 2025 was $90.7 billion, up 3.5 per cent from 2024.
Across Sydney’s regions, the south had a small net increase of two cranes, while the west, north and other areas recorded declines.
Major current Sydney projects include The Carling at Carlingford with five cranes, Harbourside in Sydney with four cranes, The Rise at Pemulwuy with four cranes, Arncliffe Central at Arncliffe with four cranes, and the Atlassian Headquarters at Haymarket with three cranes.
Melbourne pivots to civil
Victoria accounts for 25 per cent of cranes nationally, with Melbourne operating 207 cranes and experiencing a pivot from residential to civil and data centre construction.
Residential cranes now make up 41 per cent of the total, down from more than 50 per cent in previous years, while civil projects such as North East Link and Suburban Rail Loop account for 72 cranes, representing 35 per cent of Melbourne’s total.
Data centre construction in Melbourne’s west has grown strongly, and engineering projects in the state are picking up, with total construction work reflecting ongoing infrastructure investment.
South-East Queensland holds 18 per cent of national cranes, with Brisbane at 64 cranes and the Gold Coast reaching a record 75 cranes.
Gold Coast activity is dominated by residential projects, accounting for 93 per cent of cranes, while other sectors include aged care, industrial, and education.
Brisbane’s crane count has softened slightly. There are eight cranes apiece operating on the Sunshine Coast and the central coast.
Adelaide posts record high
Adelaide recorded a new high of 29 cranes, led by residential activity and supported by rising commercial and health sector construction, with total work done in South Australia at $20.7 billion in 2025, up 13.3 per cent from 2024.
Perth currently has 40 cranes in operation, reflecting stabilisation in the Western Australian construction market, while Darwin operates four cranes and Hobart has none.
Canberra has 22 cranes, Newcastle 10 cranes, and Wollongong 25 cranes, showing ongoing activity in key regional centres.
Across the country, residential construction grew by 7.3 per cent in 2025, with apartment construction particularly strong, while non-residential activity was more subdued, with commercial cranes falling from 48 to 39.
Engineering activity has increased, driven by energy and water infrastructure, hospitals, aged care, and data centre construction, and building approvals rose 15.9 per cent in 2025 compared to 2024, indicating a strong near-term pipeline.


‘Members Stay Longer’: The Commons Reworks Co-Working Model

Woods Bagot Brings ‘Great Australian Light’ to Our Newest Airport

Melbourne’s VCAT Bypass Welcomed, Construction Still Years Away

Density Takes Centre Stage in Perth’s Great Urban Reset


